The Rosalyn Project was more than just about incremental improvements to C# language features, it was about rewriting the compiler so that you can enable rich experiences during the process of software development and coding. Rosalyn has a rich analyzer which allows us to present potential issues to developers as they code rather than during some post-programming analysis. Some of us may have grown use to that kind of constant feedback using tools like Resharper, however, this type of analysis is coming at you right out of the box, with a rich API.
Light Bulb!
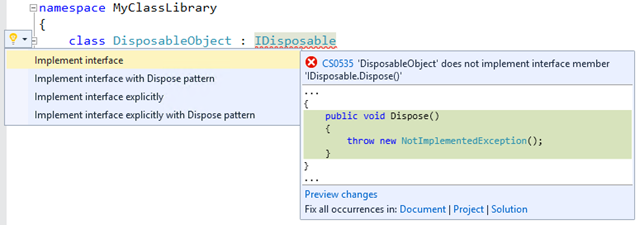
When you get the opportunity to access any of your existing projects you will notice as you hover over code that a light bulb may pop up indicating that live code analysis has detected something for you to resolve.
By clicking on the light bulb you are presented with Quick View that gives common solutions for the detected, in the above instance it is a simple removal, but this could literally be any action or choice of multiple actions. Consider the following, for example, where implementing an interface can be completed with a variety of permutations.
These are inbuilt actions but your architects and lead developer could write Smart Tags that will help your team avoid anti-patterns, or encourage the use a specific solution in your code base that already exists. With Rosalyn, this kind of analysis is not just the province of specialized companies like JetBrains, we all can and should be doing this.
Code Analysis
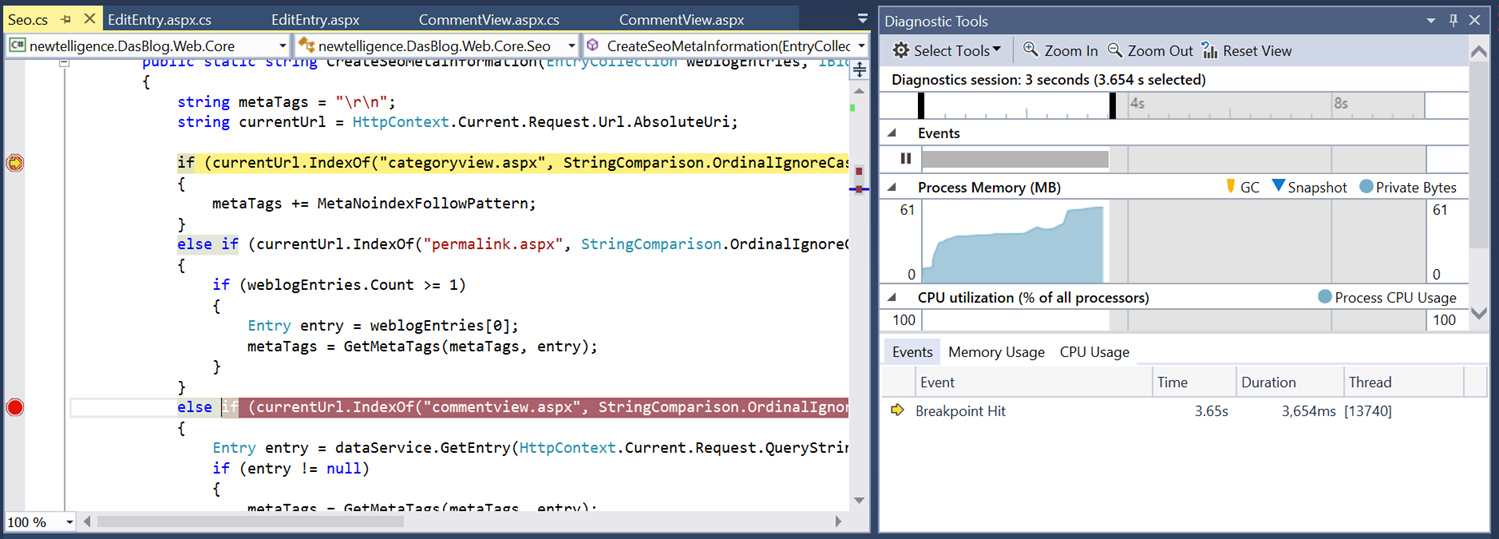
After a recent pair programming session with Scott Hanselman it was obvious that everything about Code Performance is being pushed front and center by default. You will notice the first time you hit F5 that a quarter of your screen will be dedicated to a newly formatted Diagnostic Tools section, Scott covers the Diagnosis Tool in detail here, and I advise you to go and at least get the basics down, I have a feeling this will be a big factor in improving our pre-release code.
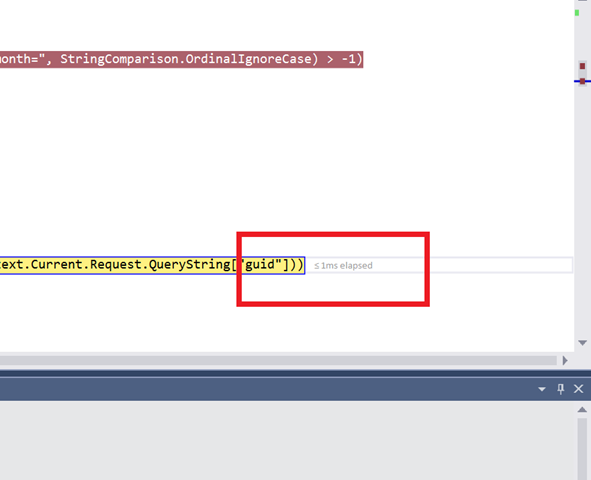
As I was debugging some code more recently I found this feature by accident, I stuck a couple of break points in a piece of code and the following inline analysis was highlighted (< 1ms elapsed).
For the problem at hand I was not actually interested in that information, but I have had to solve the problem of “how long has a specific piece code taken to run?” repeatedly during my career. In fact I am sure there is probably some heinous looking #DEBUG statement still in existence with redundant timing calculations embedded. We have all done it at least once, but now Rosalyn is at work looking at this type of data and presenting it back to you for free!


Comments are closed.