dotnet-monitor provides snapshots of .NET metrics in the Prometheus exposition format, Prometheus in turn collects metrics from targets by scraping metrics HTTP endpoints. In this post I am going to run down the steps for customizing metrics scraping for a Kubernetes cluster with the metrics addon in Azure Monitor and how to subsequently renders those metrics with Grafana in four easy steps.
Step 1: dotnet monitor configuration
The following settings ensure that the metrics endpoint is bound to an external address, and not the internal localhost. We normally cache 3 metrics so that several metrics can be picked up in one scrape. However, we ran into some issues with timestamp inconsistencies from the scraper. Today we are recommending setting a fairly low scraping interval for the metric, ‘1’ in this example.
Metrics__Endpoints: http://+:52325
Metrics__Endpoints: '1'
Step 2: Include deployment annotations
You will need to update cluster deployment to scrape certain pods and specify the port, path, and scheme through annotations for the pod.
annotations:
     prometheus.io/scrape: 'true'
     prometheus.io/path: '/metrics'
     prometheus.io/port: '52325'
     prometheus.io/scheme: 'http'
Step 3: Apply ConfigMap
You can download this metrics settings config map file and change the settings as appropriate. The podannotationnamespaceregex setting requires an update to ensure that it matches the namespace configured for your app (check your deployment). If your namespace is blank or undefined podannotationnamespaceregex will become 'default' as follows.
podannotationnamespaceregex = "default"
Save your ConfigMap and apply/deploy to the kube-system namespace for your cluster as follows (only required once).
kubectl apply -f .\ama-metrics-settings-configmap.yaml -n kube-system
This configures the Prometheus agent to check the default namespace for active pods and use the annotations in the pod (step 2) to scrape for Prometheus data, the scraping will occur on an interval defined in the ConfigMap.
Step 4: Configuring Azure Managed Grafana Dashboard
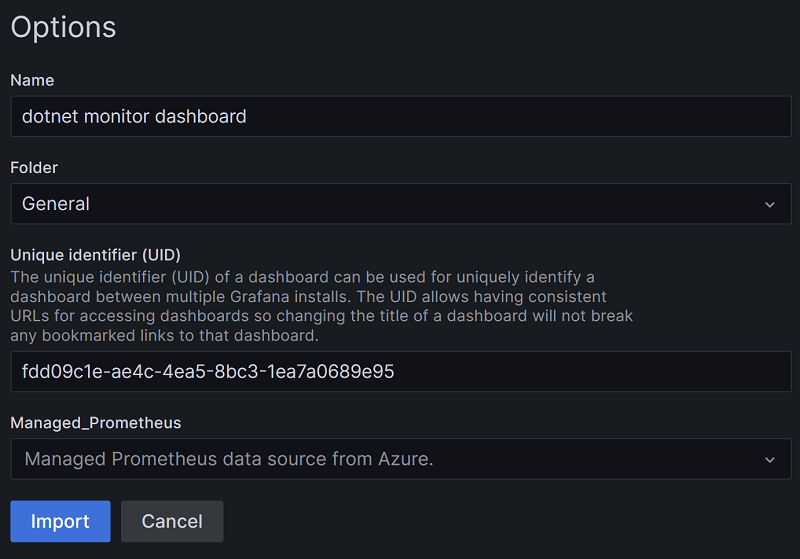
After creating your Azure Managed Grafana instance you can start designing dashboards based on the .NET metrics exposed via Prometheus. Navigate to the Dashboards page and select New->Import, this navigates to the import page where you can load a pre-configured dashboard. I created a dotnet-monitor dashboard (19297) to help quickly establish a good starting point with the default metrics shared through the Prometheus agent.
Select a `Folder` for your newly imported dashboard along with the `Managed Prometheus data source` configured earlier.


Comments are closed.