I have some really gnarly examples of code in my open source project that are ostensibly expressed as a single line of code but contain multiple instructions and actions. Some of these code expressions have emerged as part of the the natural progression of the C# language, however, it can lead to some interesting stepping challenges while debugging.
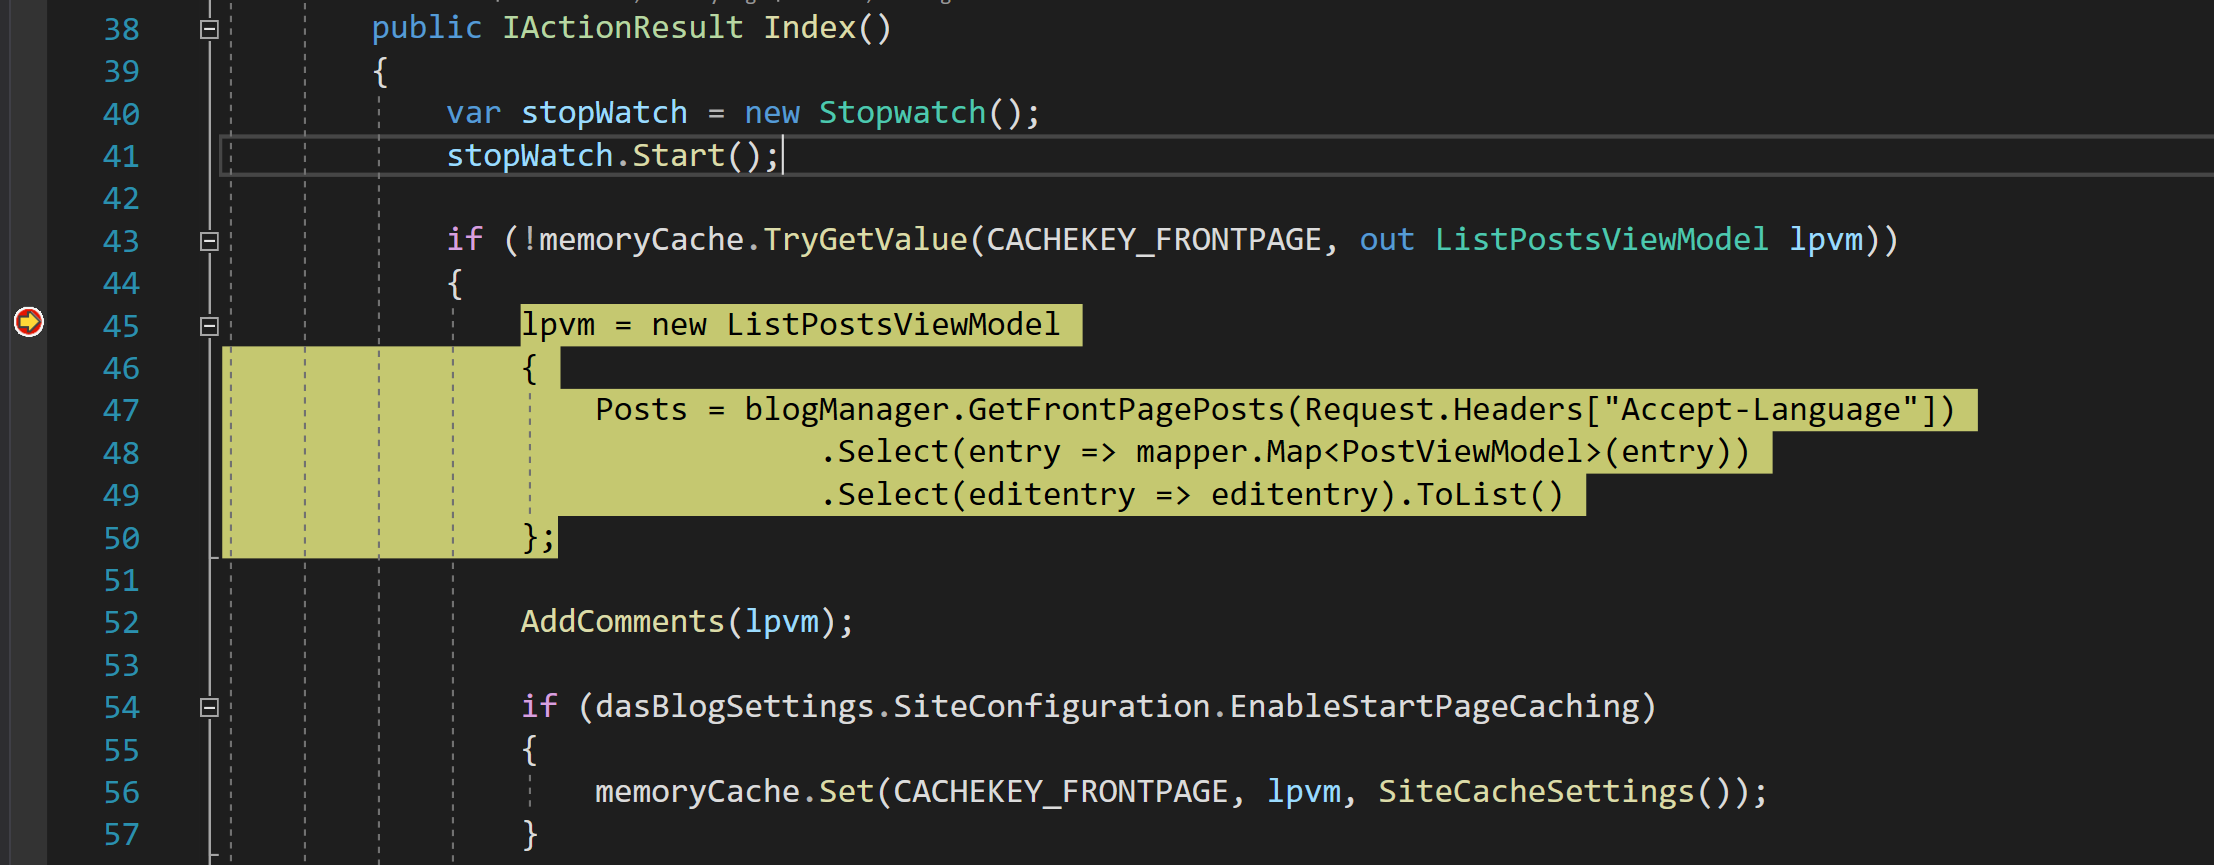
Take the following image, I have stopped at this line of code, but it expresses several things, it creates a new object and sets Posts; calls a method and performs a couple of LINQ queries.
Where would F11 (step into) take you?
If my intent was to step into the GetFrontPagePosts() method I would normally find the method definition and put a break point there hit F10 (step over) to ensure that I land in the method I want to debug. Well there is an easier way!
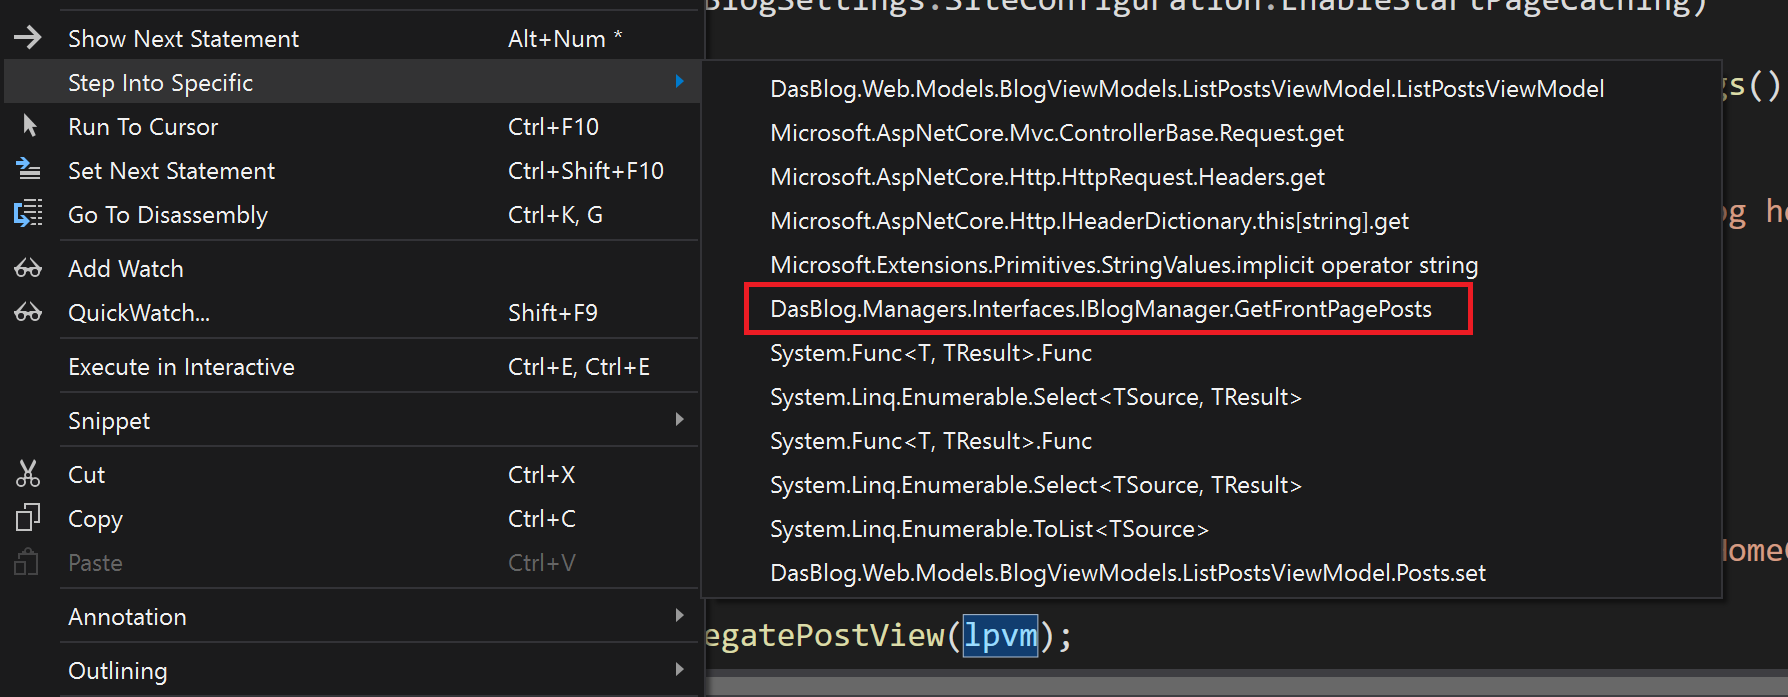
Step Into Specific
By right clicking in the code window I can bring up a context menu that allows me select Step Into Specific and shows a list of all the methods that I could step into, including all the Sets and Gets. If I go ahead and select GetFrontPagePosts() method I will land directly in that method and I can start debugging.
The existence of this Step Into option has saved me no end of time debugging issues. I hope this is helpful to you!


Comments are closed.