So a couple of posts back I was attempting to show how you could get the address of an object and identify which specific instance was on the Heap (using the Memory Usage Tool). It was brought to my attention by Christoph Nasarre that the way in which I originally found the address (i.e. Add to Locals, Go To Disassembly, address is in the first column) might be a little long winded, so I though it may be worth sharing the other two options I was also aware of.
Address from the Immediate Window
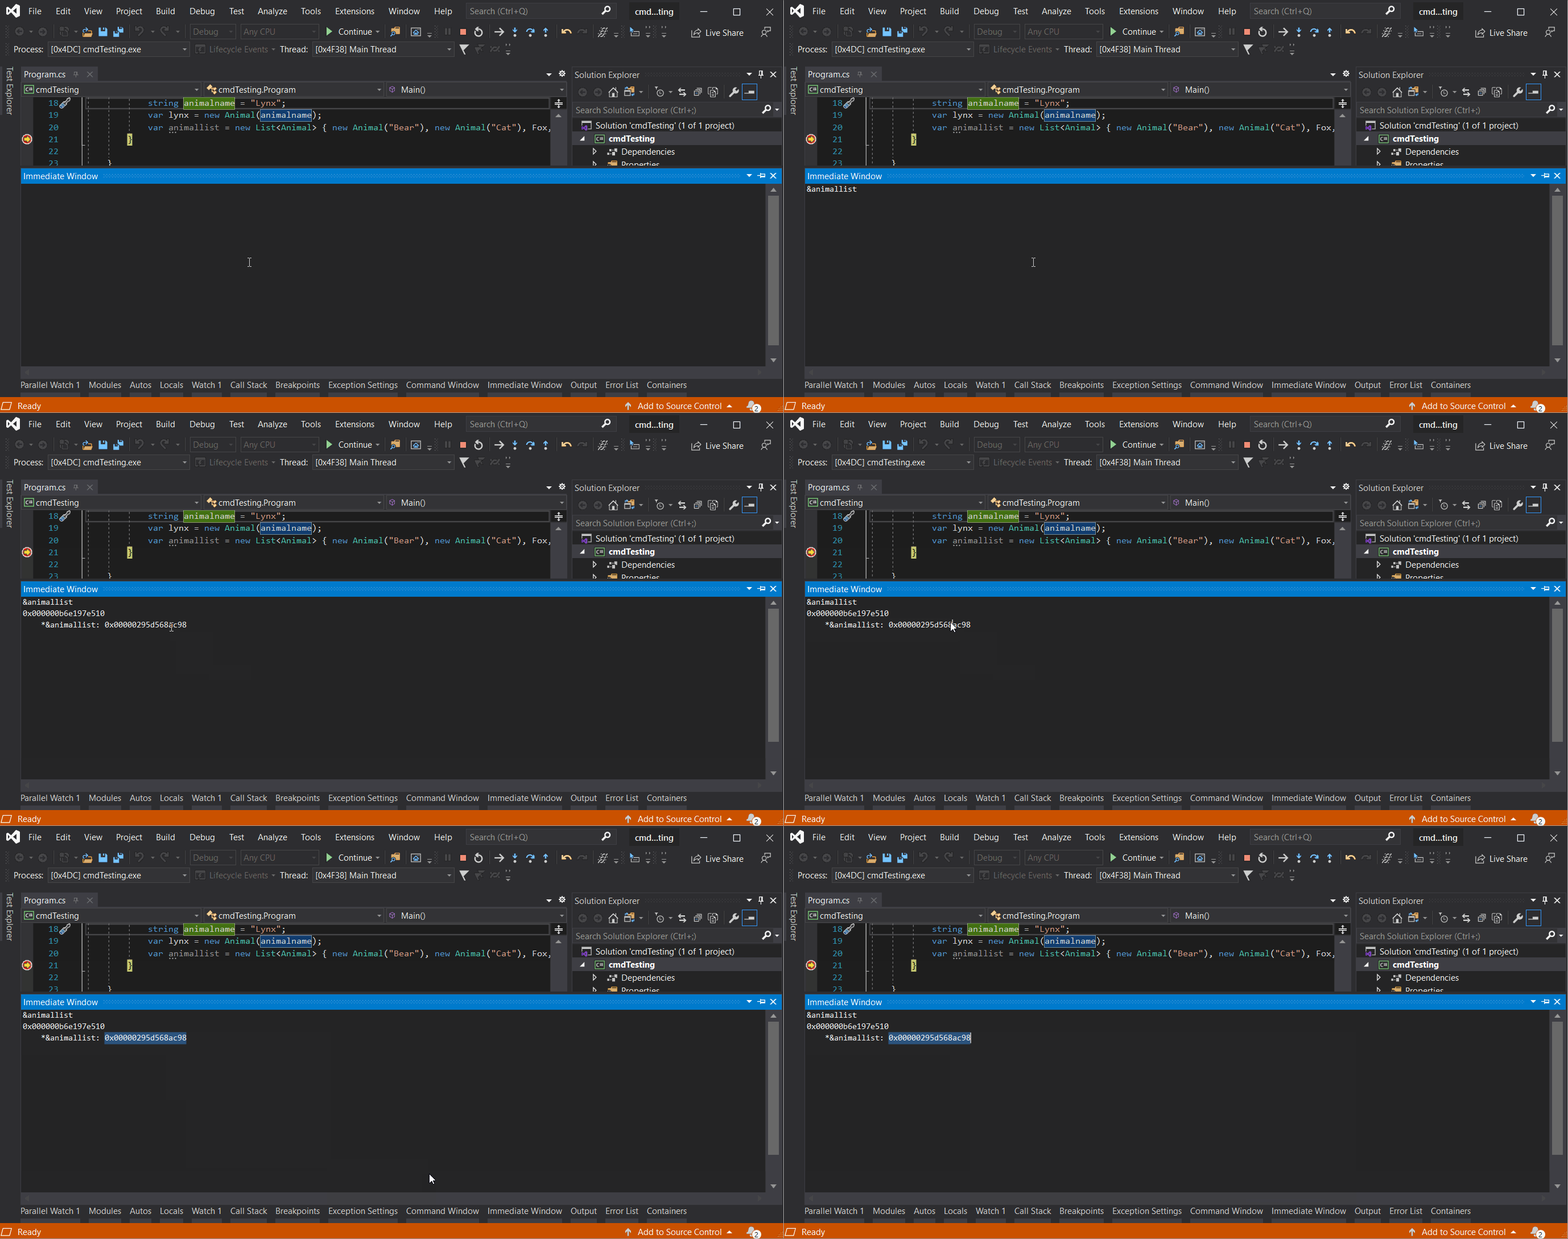
So I am going to propose that using the Immediate window might be the simplest way to grab the address of an object instance as this window is probably the most widely used. To get the address from the Immediate window do the following.
- Start debugging your app (or with a dump, after clicking Debug with Managed Code)
- Navigate to the Immediate window
- Enter the ampersand symbol ( & ) immediately followed by the variable name.
- The executed command will output the address the object instance.
Address from the Memory window
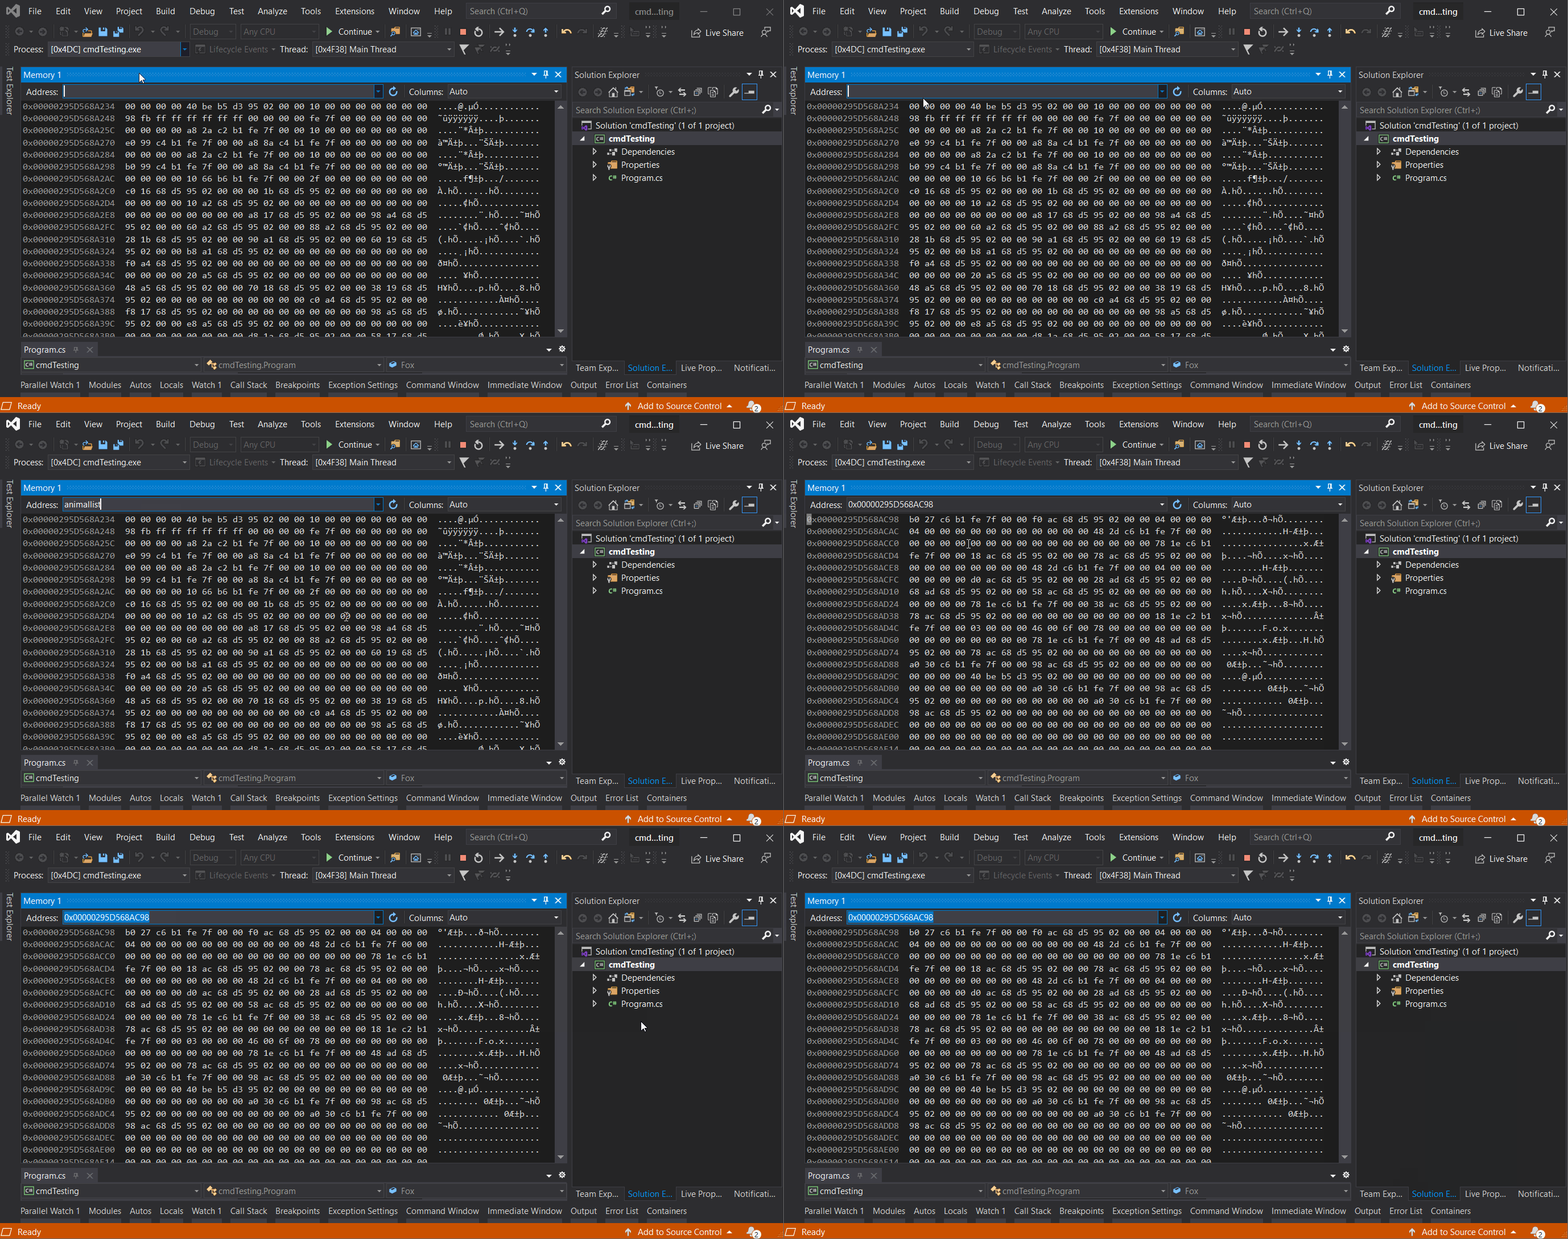
Your other option is the the Memory window, it usually used to show the big picture of the memory space your app is using. The Memory window isn't limited to displaying data, it can displays everything in the memory space, including data, code or the weird bits of garbage that get left behind. To get the address do the following:
- Start debugging your app (or with a dump, after clicking Debug with Managed Code)
- Go to Debug > Windows > Memory, select Memory 1, Memory 2, Memory 3, or Memory 4 (Community version only has one Memory window).
- Place the the name of an in scope object name into the Address box and hit enter.
- The window will refresh with the address of the object.
I really do not imagine this will be useful in regular debugging, but in memory dump debugging this kind of address based analysis and research can be really important. Happy bug hunting!


Comments are closed.