Source Link is a language and source-control agnostic system for providing first-class source debugging experiences for binaries. The main goal of the project was to enable anyone building NuGet libraries to provide source debugging for their users with almost no effort.
Source Link is supported by Microsoft, so you will find libraries and tools, such as .NET Core and Roslyn with Source Link enabled.
Setting up Source Link
Source Link is a set of packages and a specification for describing source control metadata that can be embedded in symbols, binaries and packages. As the debugger requires symbols to be available, the way to do that would be to ensure the PDB’s are alongside the DLL’s or, as I prefer, use embedded PDBs’s so they’re quite literally in the DLL already. You can enable Source Link experience in your own .NET project by setting a few properties and adding a PackageReference to a Source Link package, for projects hosted by GitHub you need to include the following properties:
Here are the properties:
<PublishRepositoryUrl>true</PublishRepositoryUrl>
<EmbedUntrackedSources>true</EmbedUntrackedSources>

<IncludeSymbols>true</IncludeSymbols>
<SymbolPackageFormat>snupkg</SymbolPackageFormat>
Here is the package reference for GitHub (there is also support for Azure Repos, Azure DevOps, GitLab, Bitbucket, etc.):
<ItemGroup>
   <PackageReference Include="Microsoft.SourceLink.GitHub" Version="1.1.1" PrivateAssets="All"/>
</ItemGroup>
How does this improve my debugging
Visual Studio has supported reading Source Link information from symbols while debugging since VS2017. It downloads and displays the appropriate commit-specific source for users enabling breakpoints and all other sources debugging experience on arbitrary NuGet dependencies. Check out my colleague Harshada's blog post on Debugging External Sources here, the debugger team is prepping a bunch more work in this space.
Improving dump debugging
My interests lie in debugging production issues, which generally means the capture and analysis of a memory dump. My team has been enabling automatic diagnostics in Azure in some important scenarios, specifically around Azure Auto Healing. If you are using the Diagnose and Solve blade in Azure you can capture dumps and traces, however, if your app has Source Link enabled, like mine, it lights up some really interesting details that can help with diagnostics.
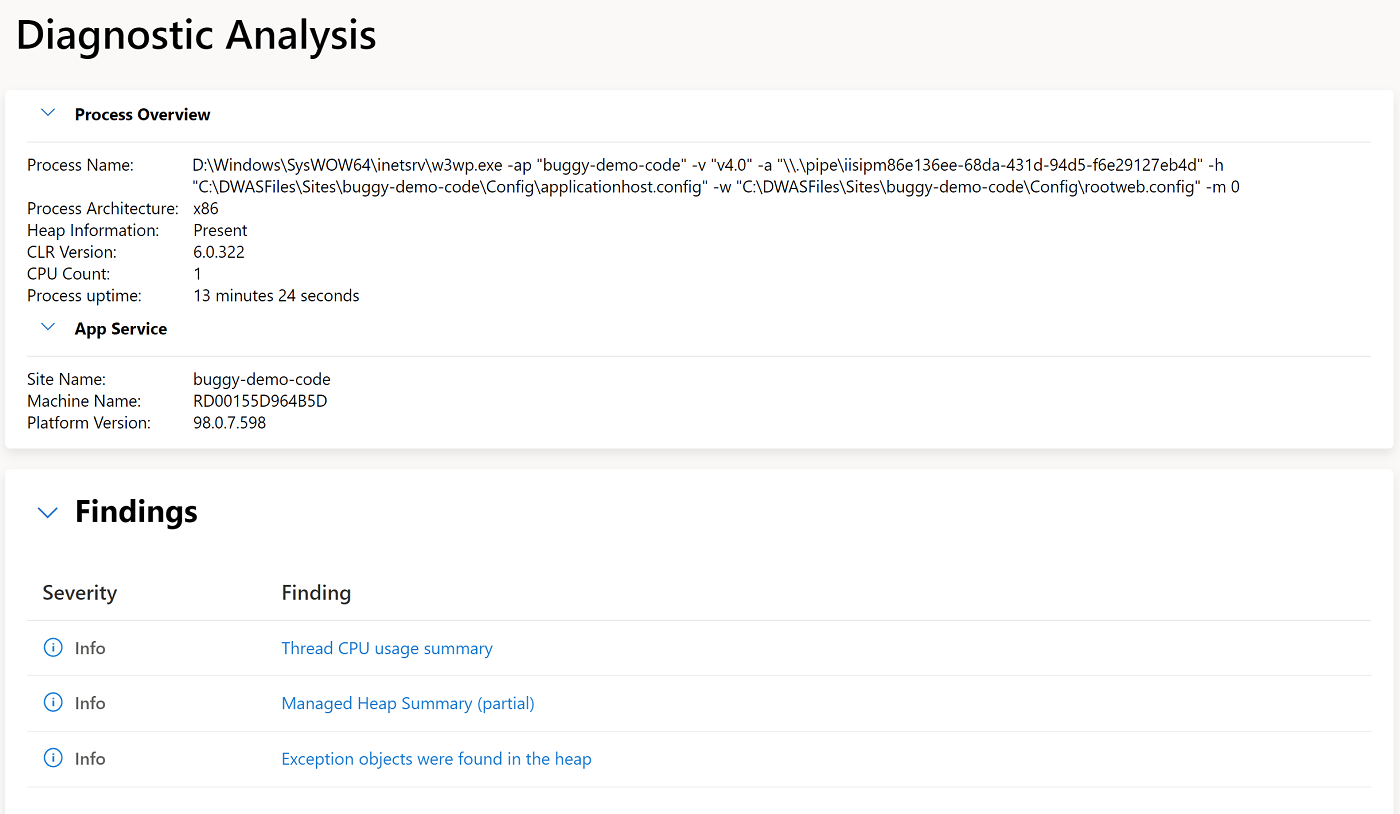
I have created a scenario where I am seeing high CPU in my App Services app. I capture a dump to try to help figure out why.
If you capture a dump manually or due to a Custom Auto Heal Diagnostics Analysis immediately kicks off and you get to see if there are any red flags or data points that need inspection, here is an example showing some of the analysis results:
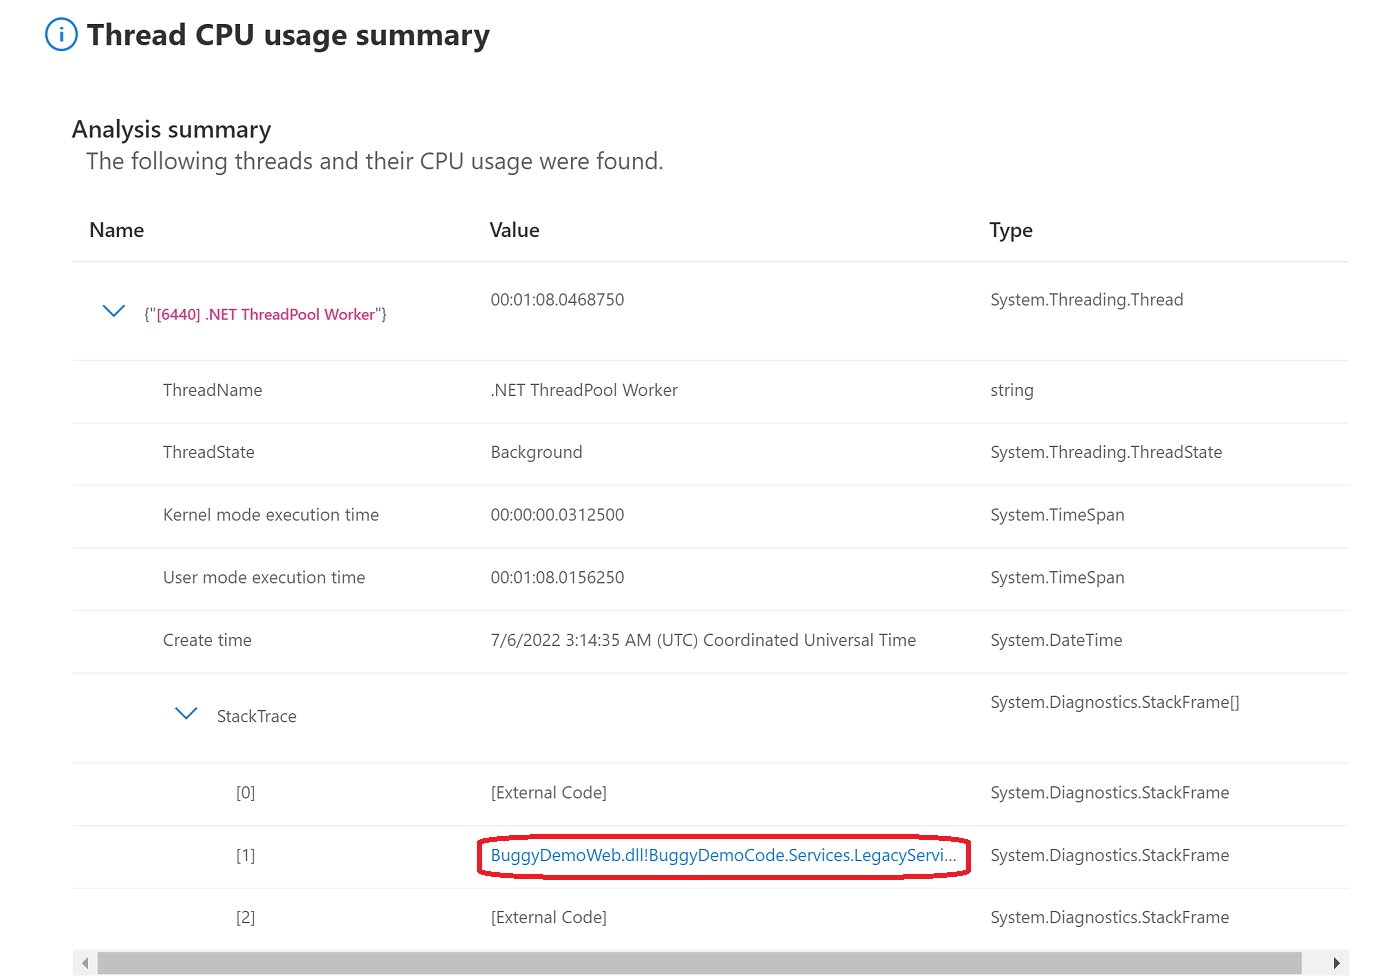
Clicking on the Thread CPU usage findings brings up an overlay with details about the running threads, some useful stats, and associated Stack Trace. This is where Source Link shines in Debugging analysis. Checking out the Stack Trace.
Here is the magic, when you do click the on the Call Frame it navigates directly to the line of code, in this case line 42.
Normally this jump from production issue to code is way more nebulous and requires a lot of debugging with either WinDbg or Visual Studio. We can now go from problem in production more directly to code in the Azure Portal. I am also confirming that this mashup of diagnostics, debugging and code is a really compelling way to ensure that teams of different technical disciplines can speak the same kind of language and fix problems in a holistic way.


Comments are closed.