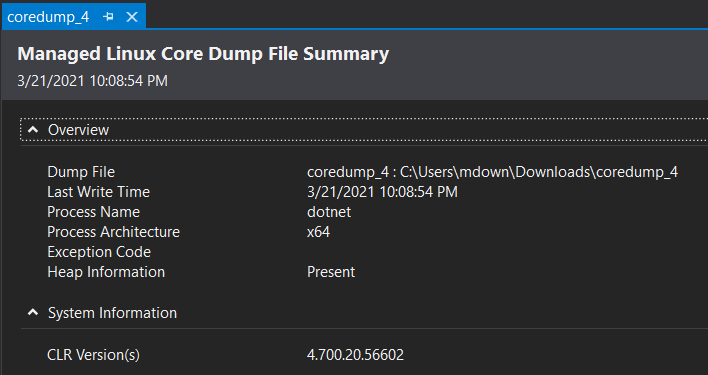
Analyzing dumps is a really popular technique to debug issues on remote machines, this is especially true when you do not have immediate access to your production environment. Devs will use a dump file from a machine when they can’t reproduce a crash or unresponsive state on their own machine. Concurrently, hosting managed apps running on Linux is gaining popularity these days, and managed tools and workflows need to better reflect this reality. To support this with Visual Studio 16.8 and above you now have the ability to open and analyze managed dumps collected on Linux and use the best in class debugging tools available in Visual Studio.
Memory dumps created on Windows machines all have well known extension (*.dmp) and thus have a straightforward association with your favorite memory analysis tools. By default, core dumps produced on Linux machines are created without an extension. If your managed core dump doesn’t have an extension you can drag and drop the file into your IDE and Visual Studio will automatically identify and open it as a Linux core managed memory dump (or use “Open With” in the Open file dialogue).
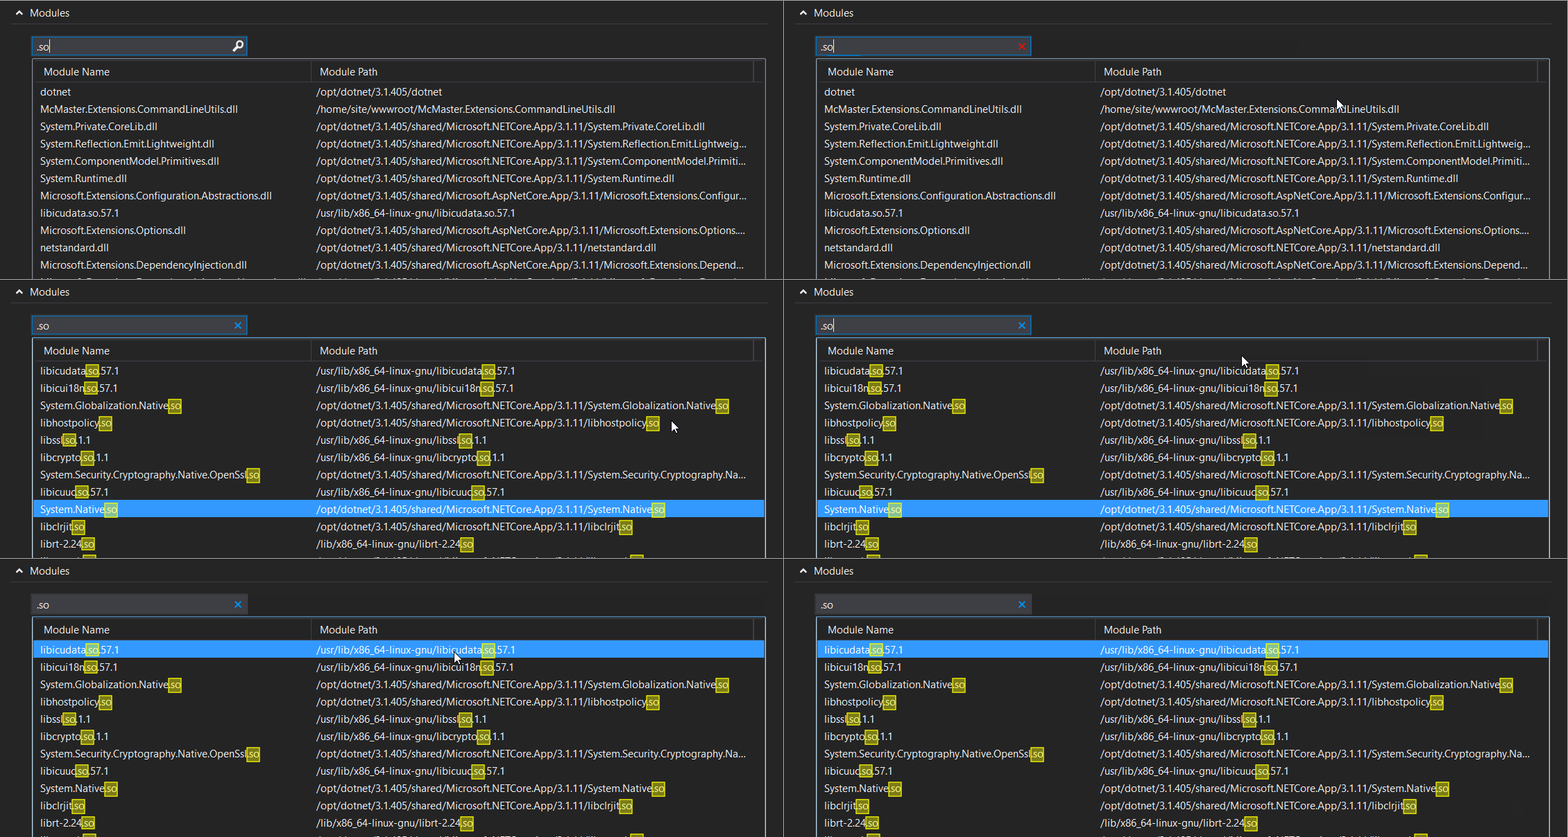
Just so you know that this is more than smoke an mirrors you you can quickly search the list of Module names and see a list of Shared Object file (.so) which are the compiled library files in Linux.
The minimum supported .NET Core version is 3.1.7, and since the original preview of this feature Visual Studio has steadily been including more supported scenarios bringing us to full parity. For example with managed Linux core dumps you are now able to:-


Comments are closed.