Most people who start coding (me included) have a natural affinity towards poor design, but we refine our approach slowly and methodically over months and years, probably as follows :-
- How do I get this app to work?
- How do I get this app to look good?
- How do I get this app to work faster?
- How do I get this app to work consistently in any environment?
Recently with so many consumers using mobile devices I have begun adding one more serious consideration to that list:
- How do I ensure that I consume as little power as possible?
I think we have just got to the point where we assume our mobile devices will give us a solid working day of use, but that assumption relies heavily on the idea of performing benign activities with a specific set of lower intensity apps. There was a really interesting post from the Windows blog recently that demonstrated how the Edge browser offers significant improvements in battery life over Chrome, they compared today’s leading browsers across three independent dimensions, here are the recorded results:
Designing for Mobile devices is not all about ensuring the UX/UI is touch friendly and accessible, it needs to include considerations and optimizations for battery consumption. I know I personally carry around power packs to ensure that I remain connected. So how exactly can we test for our coding decisions to ensure low battery consumption?
Energy Consumption Profile
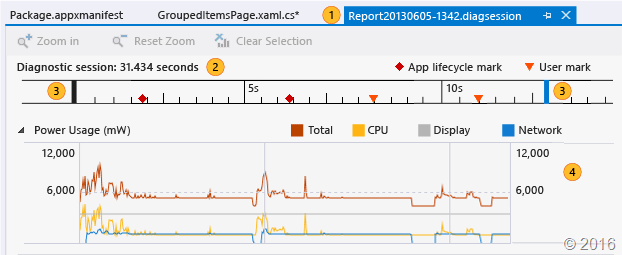
The Energy Consumption profiler in Visual Studio 2015 captures the activities of the display, CPU, and network connections of a device during a profiling session. It subsequently generates estimates of the power used and the total amount of energy for the profiling session. This is all model based analysis and thus it provides only rough estimate for a lower powered tablet or mobile device. This does not, unfortunately, include important features like GPU, Bluetooth or GPS but it is a reasonable baseline for most other normal activities.
Along the profiling timeline you have the ability to set User marks which allows you to quickly tag an area of code that you suspect could be consuming too much power. The code is as simple as this:
if (performance && performance.mark) {
    performance.mark(“Swipe on MainPage”);
}
To setup Energy Consumption Profiling in Visual Studio check out this site.


Comments are closed.