My good friend Christophe Nasarre over at Criteo wrote a great blog post on Understanding "reversed" callstacks in Visual Studio and Perfview with async/await code. He was observing Visual Studio’s default interpretation of async code in a CPU profile, and frankly, he had a compelling point but I want to offer some guidance on how to better approach the problem. Jump over and read the post here, it’s really interesting.
Done? Good.
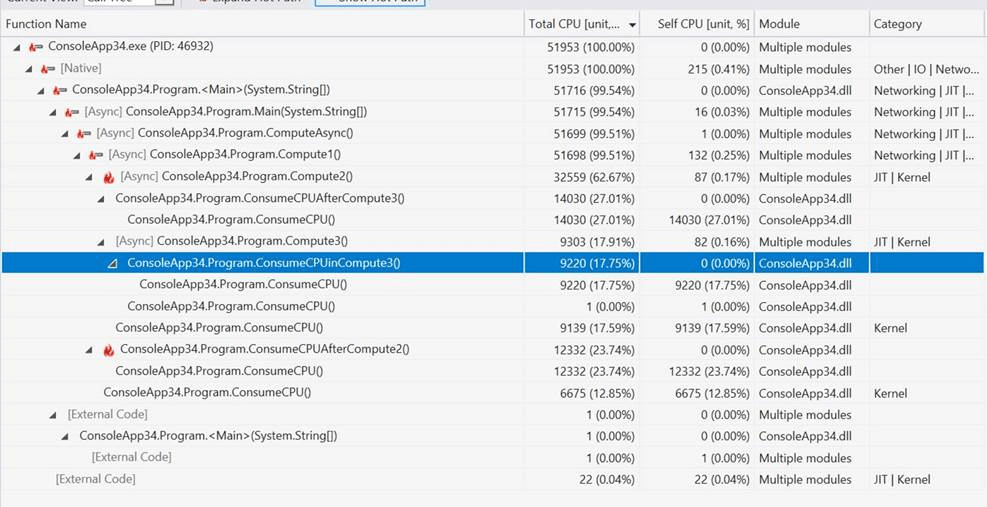
So when Christophe references the call tree, that is actually the physical stack that Windows is walking, and VS is not performing any special processing at this point. The reason Program.Compute3() shows up first (when it clearly should not) is that it is the very first method that has actual async work (i.e. Task.Delay).
If you do have a CPU profile and want to paint a better picture of the async methods you should switch on the Stitch Async Code feature (in the filter dropdown). VS will stitch together the call tree for you, and this looks much more like what we expect, note the [Async] tag at each stitch points:
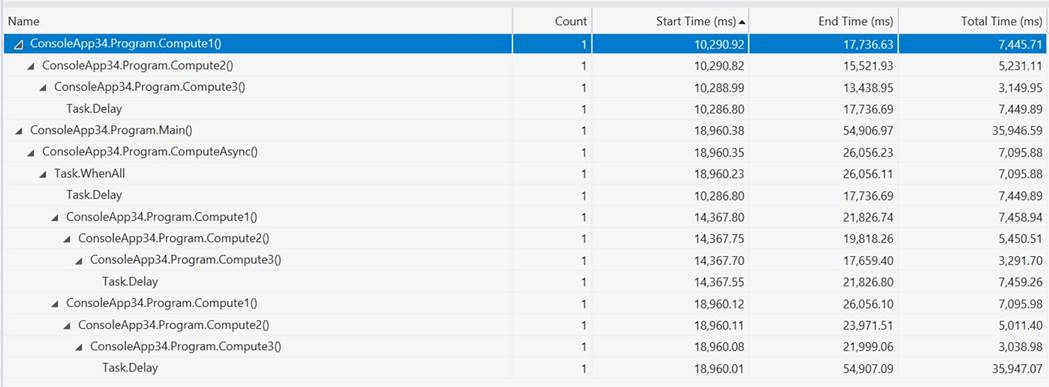
Now if you really want to get a clear picture of what's happening with async code you should enable async tracing (in addition to CPU tracing option).
In that case you would get the following:
Note that as you go down the chain the start time goes down, again because Program.Compute3() is the first method which has async work (Task.Delay) so we get a TPL Start event that notifies us some async work has begun. Once this returns and does its work contributing to Program.Compute3(), it returns firing the TPL End for Program.Compute3() and TPL Start for Program.Compute2() (A little simplified by roughly what happens).
Hope this helps.


Comments are closed.